RMX Login

The ability to make data-driven decisions with ease and confidence is vital to any competitive business. But poring over pages of reports to uncover the best conclusion is time-consuming, and sometimes complicated. Enter: data visuals, providing you with the answers you need to make the best possible decisions—all at the speed of thought.
As a Rent Manager customer, you already know the power of your data and the intrinsic value of keeping it all in one dynamic database. Watching progress and tracking trends through our built-in, customizable reports keeps you competitive and, most of all, profitable. But your time is valuable—and analyzing flat reports in black and white, or taking the time to transform your numbers into visual charts and graphs isn’t always feasible. Our brains process data visually, and digesting and storing information seen as images is more efficient and effective than text alone.
How Does Metric-X Help with Data Visuals?
The analytics experts at Metric-X know data inside and out, and love to slice and dice your information to create easily digestible visualizations for every data consumer within your operation. From stunning owner reports to simplified Google marketing analytics; comprehensive market rent comparisons to service manager issue inquiries—Metric-X can give you all the tools you need to take your data out of Rent Manager, and spring it into action. With dashboards developed exclusively for Rent Manager users, your meetings will be more productive than ever!
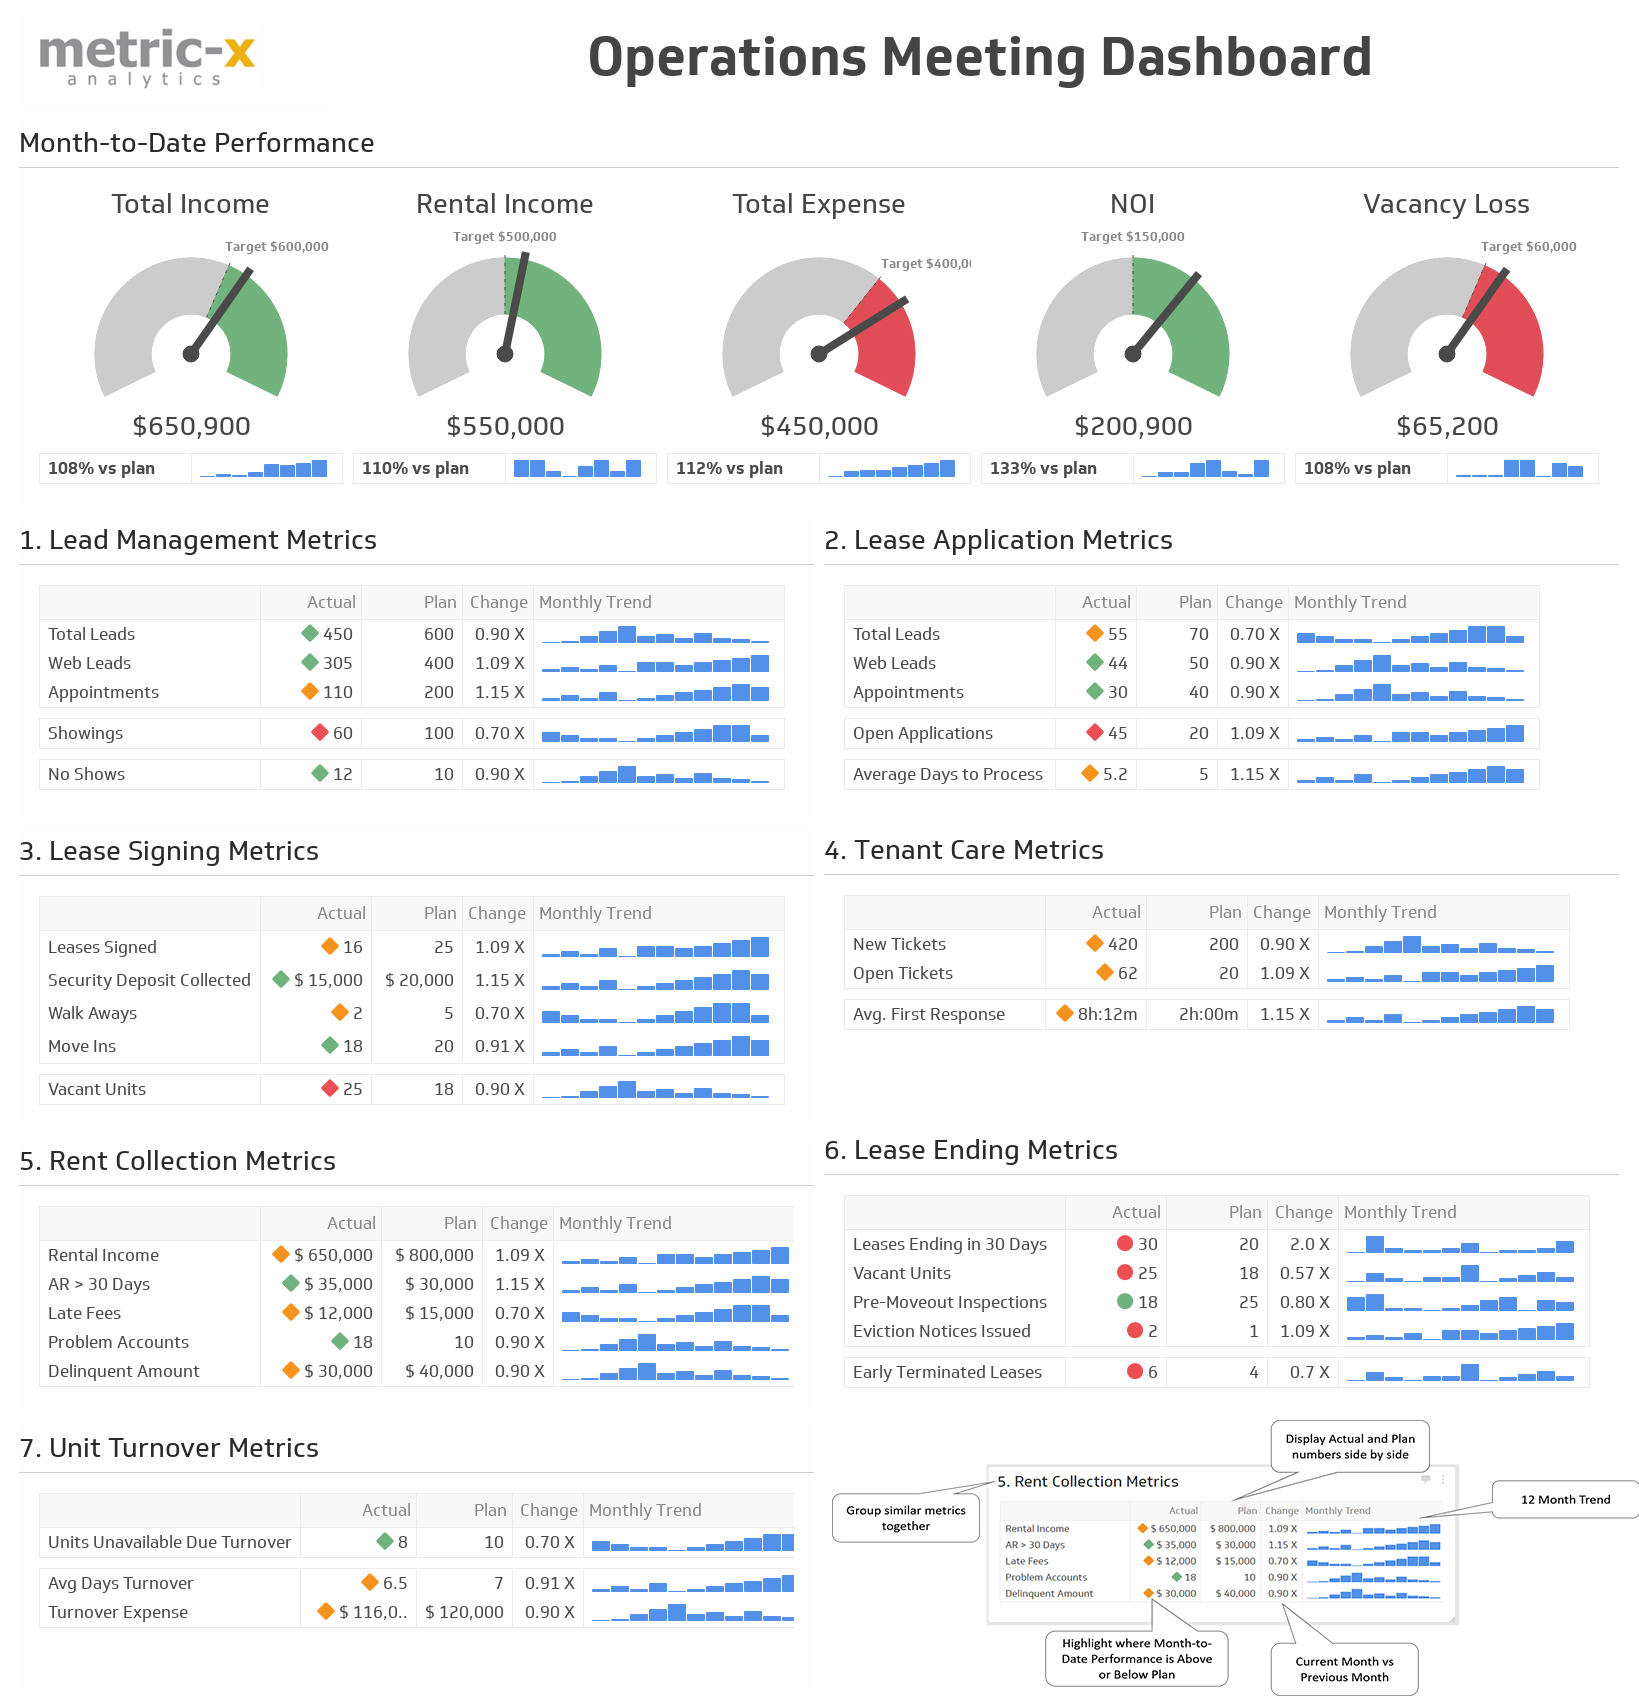
Using the Rent Manager API, data is pulled from Rent Manager and presented in attractive, visual formats. Data can be pulled at any level and you can easily toggle through metrics for each property and property group with one click. The dashboard pulls data from Rent Manager reports such as:
- Actual/Budget Fiscal Year Analysis Report
- Budget Comparison Report
- Issue List
- Customer Listing Report
- Aged Receivables Report
- Delinquency Summary Report
- Rent Roll and Recurring Charges
- … and many more! Here’s an example of one of their dazzling dashboards:
In addition to Rent Manager, data can be readily pulled from other systems, such as:
- Salesforce.com and other CRM systems
- Google Analytics and social media sites
- Other web applications
- Other Excel spreadsheets
Whether your visuals are explaining or exploring your data, make sure you’re able to speak the language of today’s data consumers by creating impressive and influential illustrations. Data visualization is a mighty and persuasive resource when making important decisions in real time, and Rent Manager’s partner, Metric-X, can help you create stunning graphics that will help move your operation forward. They can even customize a centralized business hub—placing all of your most important business metrics in one brilliant dashboard.
Conclusion
You rely on Rent Manager to track, store, organize, and explore the data your business uses each and every day. It’s the one comprehensive platform your operation depends on. Metric-X makes it their mission to help businesses manage, see, and understand their data. Together, we work to help you make the most of your data, driving decisions fueled by the power of your information, and giving you the tools to continue building successful portfolios.